


A balance sheet looks intimidating the first time you encounter one, rows of numbers organized into categories with names that sound more complicated than they actually are. But once you understand the basic structure, a balance sheet becomes one of the most useful tools available for understanding a company’s actual financial health, whether you’re evaluating a potential investment, considering a job offer, or simply trying to build genuine financial literacy.
What a Balance Sheet Actually Shows
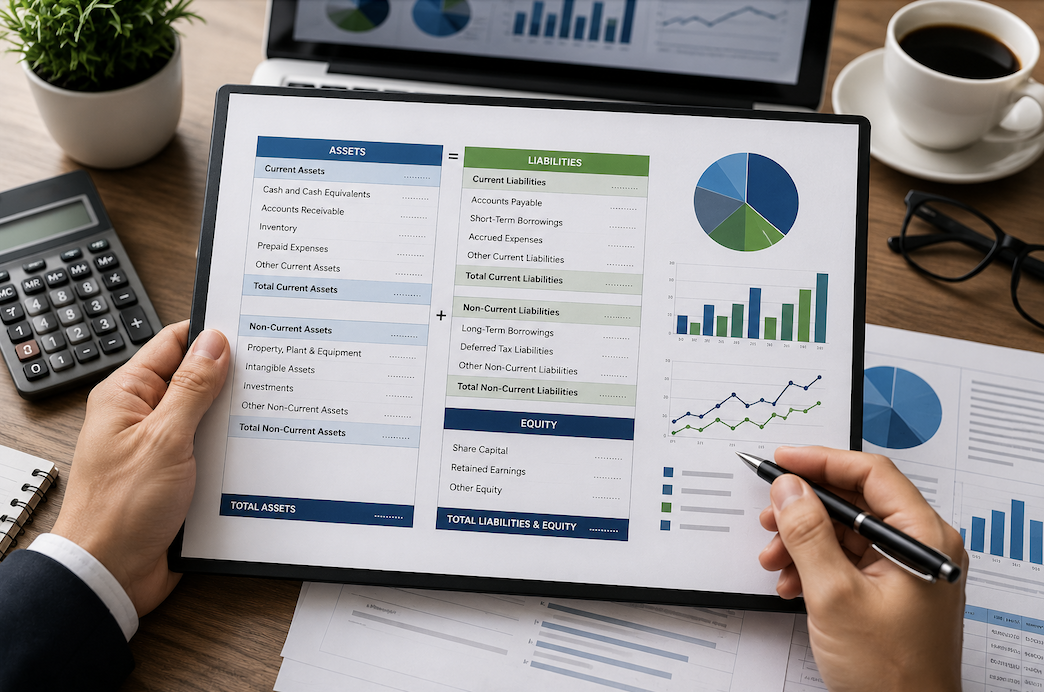
A balance sheet is a snapshot of a company’s financial position at a single point in time, unlike an income statement, which shows performance over a period like a quarter or a year. It’s organized around a simple equation that never changes: assets equal liabilities plus equity. This equation is why it’s called a balance sheet, the two sides always balance out to the same total, since everything a company owns is either financed through debt, which creates a liability, or through owners’ investment and retained profit, which creates equity.
Understanding this core equation is really the foundation for everything else on the document. Once you see how assets, liabilities, and equity relate to each other, the individual line items become much easier to interpret in context rather than as isolated numbers.
The Assets Section
Assets represent everything a company owns that has value, and they’re typically organized by how quickly they can be converted to cash, starting with the most liquid.
Current assets include cash and cash equivalents, short-term investments, accounts receivable, meaning money owed to the company by customers who haven’t yet paid, and inventory, meaning products the company has produced or purchased but not yet sold. These are all expected to convert to cash or be used up within a year.
Non-current assets, sometimes called long-term or fixed assets, include things like property, equipment, and buildings, along with intangible assets like patents, trademarks, and goodwill, which represents value from acquisitions above the fair value of the acquired company’s tangible assets. These assets aren’t expected to convert to cash within the next year and often represent longer-term investments in the company’s operations.
The Liabilities Section
Liabilities represent everything a company owes to others, also organized by how soon the obligation is due.
Current liabilities include accounts payable, meaning money the company owes to its suppliers, short-term debt due within a year, accrued expenses like unpaid wages or taxes, and any portion of long-term debt coming due within the next twelve months.
Non-current liabilities include long-term debt not due within a year, deferred tax liabilities, and other long-term obligations like pension commitments. A company with a large amount of long-term debt relative to its size isn’t automatically in trouble, debt financing is a completely normal and often strategic way to fund growth, but it’s worth understanding in the context of the company’s overall financial picture and its ability to service that debt.
The Equity Section
Equity, often called shareholders’ equity or stockholders’ equity, represents the ownership value remaining after subtracting total liabilities from total assets. This section typically includes common stock, representing the value raised from selling shares, retained earnings, representing accumulated profit that hasn’t been distributed to shareholders as dividends, and sometimes additional paid-in capital, representing amounts investors paid above the stated par value of shares.
Growing retained earnings over time is generally a positive sign, suggesting the company has been consistently profitable and choosing to reinvest those profits rather than needing to rely heavily on additional debt or stock issuance to fund operations.
Key Ratios That Make a Balance Sheet More Useful
Raw numbers on a balance sheet only tell part of the story, and calculating a few basic ratios helps put those numbers into meaningful context.
The current ratio, calculated by dividing current assets by current liabilities, measures whether a company can cover its short-term obligations with its short-term assets. A ratio above one generally suggests the company can meet its near-term obligations, though what counts as a healthy ratio varies somewhat by industry.
The debt-to-equity ratio, calculated by dividing total liabilities by total shareholders’ equity, shows how much a company relies on debt versus owner investment to finance its operations. A very high ratio can indicate higher financial risk, particularly if the company’s earnings are volatile, though again, what’s considered reasonable varies significantly by industry, with capital-intensive industries like utilities or manufacturing typically carrying higher debt levels than software or service-based companies.
Working capital, calculated by subtracting current liabilities from current assets, shows the actual dollar amount of resources available for day-to-day operations after covering near-term obligations. Consistently negative working capital can be a warning sign, though certain business models, particularly ones with fast inventory turnover and upfront customer payment, can operate successfully with lower working capital than others.
What to Look For Beyond a Single Snapshot
Because a balance sheet only shows a single point in time, comparing balance sheets across multiple periods, quarter over quarter or year over year, reveals trends that a single snapshot can’t show on its own. Is debt increasing or decreasing over time? Is cash position growing or shrinking? Are retained earnings consistently increasing, suggesting sustained profitability? These trends often matter more than any single number in isolation.
It’s also worth comparing a company’s balance sheet ratios against others in the same industry, rather than judging them against an arbitrary universal standard, since normal and healthy financial structures vary meaningfully across different types of businesses.
Common Red Flags Worth Knowing
A few patterns are worth watching for specifically. Rapidly increasing accounts receivable relative to sales growth can suggest a company is struggling to actually collect payment from customers. Consistently declining cash reserves without a clear strategic reason can signal underlying operational problems. And a debt-to-equity ratio that’s climbing significantly and consistently, especially combined with declining profitability elsewhere in the company’s financials, deserves closer attention before drawing conclusions.
None of these patterns alone definitively means a company is in trouble, context matters enormously, but they’re worth investigating further rather than dismissing outright if you notice them while reviewing a balance sheet.
Conclusion
You don’t need an accounting degree to get real value from reading a balance sheet. Start by understanding the core equation, assets equal liabilities plus equity, then work through each section methodically rather than trying to absorb everything at once. Practice with a few balance sheets from companies or industries you’re already familiar with, since having some context makes the numbers easier to interpret meaningfully.
Over time, what initially looks like an intimidating wall of numbers becomes a genuinely useful tool for understanding financial health, whether you’re evaluating an investment, a potential employer, or simply building your own financial literacy.
- Read more about Newspinup!
Frequently Asked Questions
1. Where can I find a public company’s balance sheet?
Public companies are required to file balance sheets, along with their other financial statements, as part of their quarterly and annual reports with securities regulators. These filings are typically available for free through the regulator’s own database, or through the investor relations section of the company’s own website, often presented in a more reader-friendly format than the raw regulatory filing.
2. Why does a balance sheet always have to balance?
This reflects a fundamental accounting principle: every asset a company owns has to be financed somehow, either through debt, which becomes a liability, or through owner investment and retained profit, which becomes equity. Because every dollar of assets is accounted for by one of these two funding sources, the two sides of the equation always equal each other by definition.
3. Is more debt on a balance sheet always a bad sign?
Not necessarily. Debt is a completely normal and often strategic tool for financing growth, and many healthy, well-run companies carry meaningful debt loads. What matters more is whether the company generates enough consistent earnings to comfortably service that debt, and how its debt levels compare to similar companies in the same industry, rather than looking at the raw debt figure in isolation.
4. How often are balance sheets updated?
Public companies typically release updated balance sheets quarterly, alongside their other financial statements, with a more comprehensive annual report at the end of each fiscal year. Private companies may prepare balance sheets on varying schedules depending on their own internal reporting needs or requirements from lenders and investors.
5. Can a balance sheet alone tell me whether a company is a good investment?
No, a balance sheet is one important piece of a much larger picture. It’s most useful when reviewed alongside a company’s income statement, which shows profitability over time, and cash flow statement, which shows how cash actually moves in and out of the business. Together, these three statements provide a far more complete picture than any single document reviewed in isolation.
6. What’s the difference between book value and market value when reading a balance sheet?
Book value refers to the value of assets and equity as recorded on the balance sheet, based on historical cost and standard accounting rules. Market value, particularly for a public company’s equity, reflects what investors are actually willing to pay for shares on the open market, which can differ significantly from book value based on growth expectations, brand value, and other factors the balance sheet doesn’t directly capture.
